DepthAI 管道图
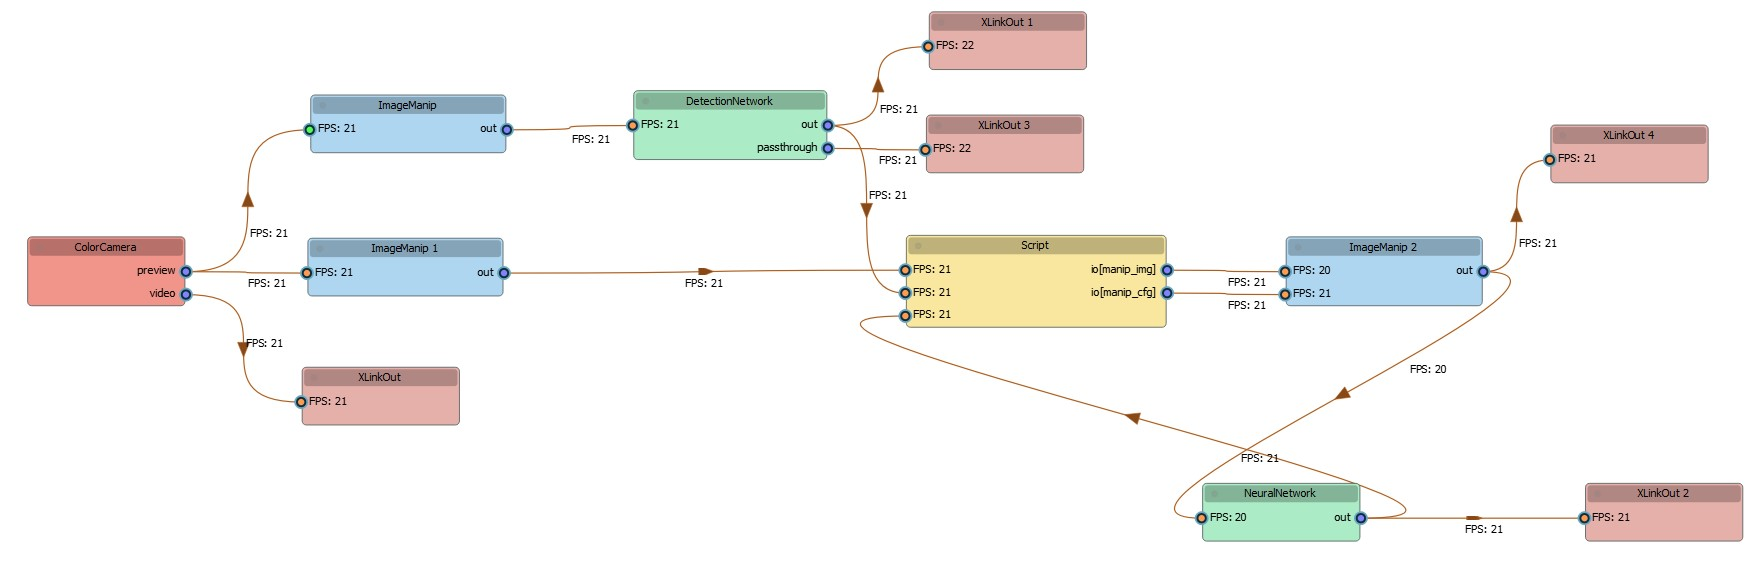
工作原理
DEPTHAI_LEVEL=debug,JSON 配置将打印到控制台:Command Line
1[2022-06-01 16:47:33.721] [debug] 模式转储:{"connections":[{"node1Id":8,"node1Output":"passthroughDepth","node1OutputGroup":"","node2Id":10,"node2Input":"in","node2InputGroup":""},...]pipeline_graph 工具执行以下步骤:- 设置
DEPTHAI_LEVEL=debug - 运行你的代码
- 从输出中捕获模式转储
- 解析模式,使用修改版的 NodeGraphQt 创建可视化图形
安装
Command Line
1pip install git+https://github.com/luxonis/depthai_pipeline_graph.gitCommand Line
1pip install PySide2运行工具
Command Line
1pipeline_graph -hrun、from_file 和 load。可用操作
- 运行:执行你的 DepthAI 脚本并实时生成管道图。
Command Line
1pipeline_graph run "python your_script.py"-dnk 选项可以让脚本在捕获模式后继续运行:Command Line
1pipeline_graph run "python your_script.py" -dnk- 从文件:从日志文件或 JSON 模式生成管道图:
Command Line
1pipeline_graph from_file path/to/your/log_or_json_file- 加载:加载并编辑之前保存的管道图:
Command Line
1pipeline_graph load path/to/your/saved_graph.json自定义选项
节点命名
ColorCamera (0)),索引表示创建顺序。 如果同一类型的节点很多,可以使用 -var 或 --use_variable_names 选项,将索引替换为代码中的变量名,以提高清晰度。Command Line
1pipeline_graph run "python your_script.py" -var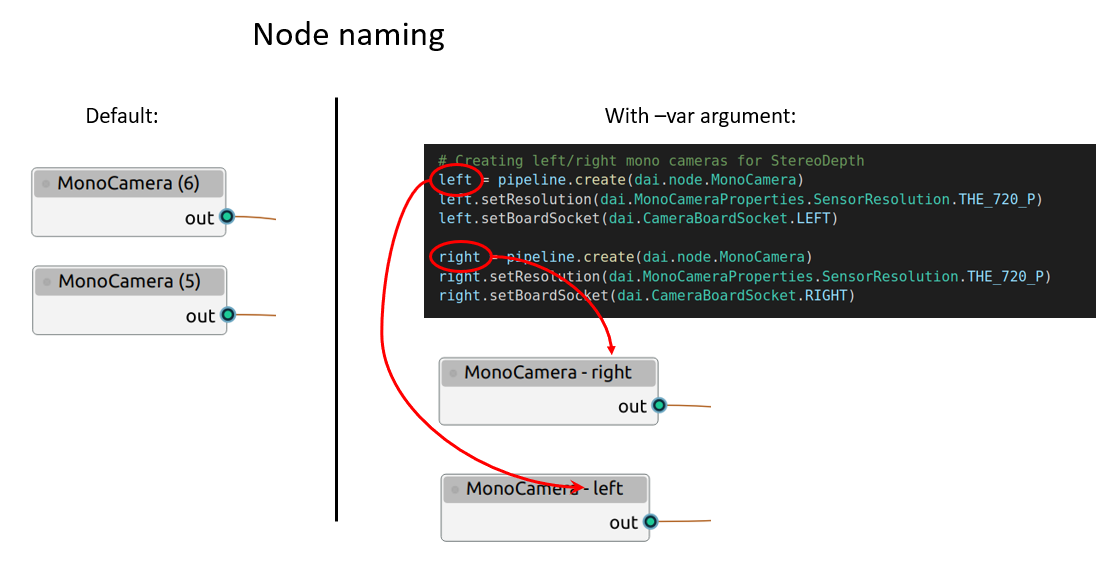
-p 或 --pipeline_name 参数指定其他名称。Command Line
1pipeline_graph run "python your_script.py" -var -p custom_pipeline_name与图形交互
- 重新排列节点:只需拖放节点来调整布局,如果默认位置不满足需求。
- 重命名节点:双击节点名称直接编辑。
- 更改节点外观:双击节点本身(不在名称区域)打开窗口,可以修改其颜色和名称。
- 右键菜单选项:在图形上任意位置右键单击弹出菜单。可以在此保存图形为 JSON 文件、加载之前保存的图形或访问其他选项。